I would like to have time series of a tower member load (Fx, Fy, Fz, Mx My Mz) for all the load cases.
I used the multiple plots option and used the option “tabulate graph data in” with a txt file.
The problem is that all time series are written in only one file (that become very big for the number of load cases). Is it possible to have them in separate txt files?
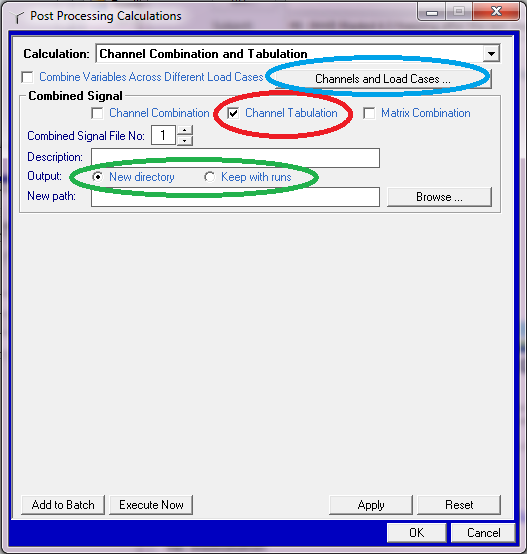
The easiest way to output selected loads data into text files for each load case is to use the "channel tabulation" option in the channel combination calculation (as shown inside the red circle below). When you have selected this option you can define the variables and load cases which you would like to consider by pressing the ‘channels and load cases’ button as shown in the blue circle above. Then you can define if you would like the outputs to be kept with the runs or put in a new directory (see green circle). If you choose that you would like a new directory for the outputs then you can define the path using the browse button.
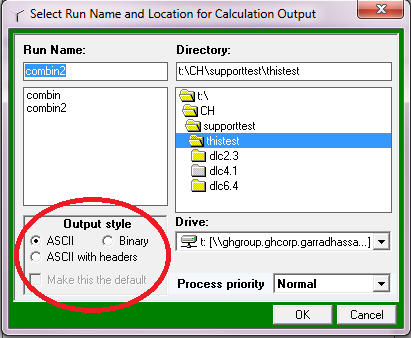
When you run the simulation you will have the option of choosing the output style for the files, either ASCII or Binary format (See red circle below)
After the simulation has run you should find that the time series of the variables which you selected will be output in columns with one file for each load case.